Sunday, January 1, 2017

Stock Market Forecast January 2017 through June 2017: Negative

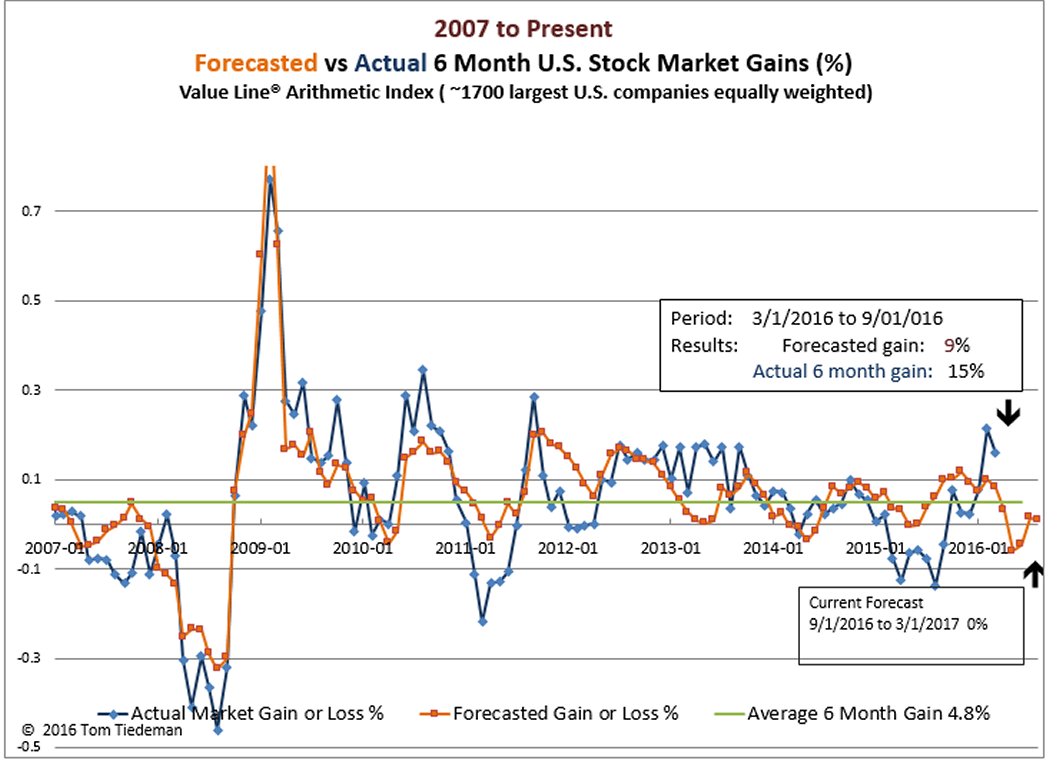
Over the second half of 2016 my stock market forecasting models had expected the U.S. stock market to go nowhere.  Instead, the market staged a strong 11% increase.  I was pretty far off base. (Sam E. -- You won this round!)

What's going to happen now?  My models still see disappointment coming -- roughly a 5% market decline over the first half of 2017.

The econometric models don't know anything about what the Trump administration will try to do for the U.S. economy, or what Congress will actually vote for.   All the models say is that compared to the last three decades of market behavior, stock prices are pretty high.  Some unrealistic economic hopes are likely to evaporate.

For the first half of 2017 the market is not expected to make a huge move either up or down. Calling any major market move is all that my models are actually trying to accomplish.  Precise prediction is beyond the forecasting models' scope. So, on that score my models do not see things aligned to force prices into a huge and lasting move either up or down.  If, however, the market does shoot up or crash down over the next few months, the models will expect the market to retrace its steps.

If long term economic factors exert their normal force on stock prices, most probably U.S. stocks will be about 5 percent lower come summer.  The probability of breaking even is only about 40% -- much lower than the long term record of the market at least breaking even 73% of the time.


(Click on image to enlarge.)


Wednesday, November 30, 2016

Stock Market Forecast December, 2016 to June 2017: Flat

My statistical model expects the U.S. stock market to tread water for the first half of 2017: no net gain and just about a 50/50 chance of breaking even.

The model sees no reason for the stock market to do much of anything other than fret.  Stocks are making new highs. Gross Domestic Product and employment have been rising. Interest rates are still incredibly low.  Odds of a near-term recession are fairly low.

The market has priced in all of this good news, so the model sees little upside potential. There could certainly be a significant surprise to the downside -- but the model does not see any of the usual culprits ready to strike.

None of this, of course, means that stock prices will actually laze around.  It just means that the market is going to have to do its gyrations without much of a push from the factors that historically have led to major price movements.

Enjoy the rest of the year!


Saturday, October 29, 2016

Stock Market Forecast November 2016 thru April 2017: No Gain

The new 6 month stock market forecast from the model  (November through April, 2017) is for zero gains and a slightly below average chance of just breaking even.  The models know nothing about the upcoming presidential election, so it should be no surprise if the next half year proves to be volatile.

I have a correction to make in last month's market prediction.  A data error caused the model to project a 6 percent loss for the stock market.  Corrected, the forecast for next March is for no net gains.  Please accept my apologies.

As seen in the chart below, for the last year or so the market has followed the same general direction as my forecasts made a half year previously.   As is typically the case with models such as mine, the actual market moves tend to be somewhat greater -- both up and down -- than the model expected. And, that's OK.  The goal of the model, after all, is to foretell the basic direction of the U.S. stock market, not to be fully accurate.  There is much too much volatility in the world for a simple mathematical model like mine to be anywhere near exact.


(Click on image to enlarge.)


The last call of the short term trading strategy was negative.  It will take some positive forecasts for that to turn around.


(Click on image to enlarge.)


Saturday, October 1, 2016

Stock Market Forecast October 2016 thru March 2017: Negative

Just when I thought my forecasting models were starting to look up, the predictive market models models have turned decidedly negative.  For the next 6 months the models project that there will most probably be a loss of about 6% and only about a 50/50 chance of at least breaking even -- well below the 73% historical average of breaking even in any random 6 month stretch.

My negative forecast, of course, doesn't mean the market must go down. The forecast means only that if the market responds to the same influences that have tended to drive it for the past three decades, then it probably will face real (but, hopefully not too scary) difficulties.

Since, my forecast is neither extremely negative or positive, it wouldn't surprise me if, for the next few months, outside events, such as the presidential election overshadowed the sorts of economic realities that define my forecasting models.


(Click on image to enlarge.)


Saturday, September 17, 2016

Will the Stock Market Break Even Over the Next Half Year?

Each month since  October, 2007 I have posted predictions for the U.S. stock market for the coming six months.  That's 9 years of forecasts, so I think it's about time for a reckoning. Are my forecasts for U.S. stock market gains worth anything? Or are my predictions just plain bogus?

The excellent news is that my break even models have performed quite well .  The models are just as valid now as when I started using them in 2007.  The models are far from perfect, but they generally foretell major stock market moves.

This blog post focuses on my forecasts of the probability that the U.S. stock market will at least break even over the next 6 months.  In another post I will review the separate models I use to estimate how large gains or losses will be.

Were Break Even Forecasts Basically Useful?

The chart below shows the growth of the Value Line Arithmetic Average (VALUA) from 1984 through 2016 Q1. This index tracks the roughly 1700 large U.S. companies that are followed by the highly respected Value Line Investment Survey.  Unlike measures such as the S&P 500 Index, or the NASDAQ Composite Index, VALUA gives equal weight to each stock. No stock is more important to the index that any other. The distinction is important -- VALUA ends up being much less volatile and speculative than the other market indexes.That makes VALUA much more predictable than other indexes.

For the entire period  from 1984 through 2016 Q1 VALUA has risen  during 73% of all the 6-month periods, making 0.73 the average probability of VALUA rising in any half year period.

I have superimposed a series of green dots to show the dates when my forecasting model concluded optimistically that the probability of the market going up was 90% or better.  Likewise a series of red dots mark where my forecasts of the market at least breaking even were 50% or less. (The rest of the time the forecasts were middling -- neither very optimistic or pessimistic.)
(Click on image to enlarge.)

Overall, the pessimistic forecasts (red) do tend to come before significant market corrections, rather than coming after the market has already collapsed.  For the forecasts made in real time from 2007 on, all of the pessimistic forecasts were valid.  All but one were timed exceedingly well. The remaining recent pessimistic forecast did foretell a market break, but the break came months later than expected.

Optimistic forecasts (90% or better chance of a market rise)  were much more common in both  real time and historical data.  Generally, the optimistic forecast points do appear to lead favorable market periods. It is clear, however, that optimistic forecasts are frequently premature -- even though the market future has improved, the stock market may still be in the process of crashing.

What About Break Even Forecasts That Were Terribly Wrong?

The next graph shows when my probability of market gain forecasts were dramatically wrong.  Forecasts marked in green as Too Optimistic were those where the calculated probability of the market rising was above 90%, but the actual result was that the market dropped at least 5%.  Forecasts appearing in red were Too Pessimistic -- the forecast was that the probability of break even was less than 50%, but instead of falling the market actually gained at least 5% in the following 6 months. 


(Click on image to enlarge.)

Fortunately, there were relatively few points when the probability of gain forecasts were really bad. Eyeballing the chart above, it is reasonable to conclude that every few years, the model makes a really bad market call.  In most cases, even though the market rose after a very pessimistic forecast, it appears that the pessimistic forecast was just issued too early -- the market did indeed tumble, but months after the model expected the market to break.

To my surprise there were no instances of really bad forecasts during my real-time testing from 2007 on.  I have no doubt that at some times in the future the model will again make some really bad market calls.  The accumulated experience, however, encourages me to think that really poor stock market calls will not happen more frequently than every few years.
basic

Has There Been Any Basic Change in the Factors that Move the Stock Market?

The general goal of modelling the stock market is to find consistent relationships for a small number of factors that reasonable might be expected to affect the market going forward.  The stock market responds almost instantly to countless sorts of news but no model can be reasonably be developed that will reflect all of those factors.  So, the real problem is finding just a small number of important factors that consistently affect the general direction of the market going forward.

In 2007 the stock market forecasting models I came up with tracked the past performance of the market pretty well.  The question now is whether the model needs to be changed to reflect new sorts of factors that may have developed over the past decade?  Maybe the basic nature of the stock market has changed enough so that an entirely new sort of model needs to be used going forward? Maybe some of the old factors that seemed to be relevant really aren't?

Good news.  The same factors that seemed important based on data from 1984 to 2007 appear to be behaving in almost exactly the same way since then.  There really hasn't been a large shift in the basic factors that affect stock prices.

The plot below compares the forecasts for the probability of stock market gains based on my old 2007 model and based on the same model that has been re-balanced to reflect all the new data since 2007.  The changes to the model that should be made are very minor:  the new forecasts for probability of breaking even match the old forecasts 99.8%. There is almost no change.


Thursday, September 1, 2016

Stock Market Forecast September 2016 thru February 2017: No Net Gain

Six months from now the U.S. stock market should wind up right where it is today, at least that is what my forecasting models expect. No net gain for he next six months and only about a 50/50 chance that stocks do better than break even. In between, the models have been expecting the market to stumble with a drop of perhaps 5%.

What's up?  The market has been hitting new highs so there is relatively little likelihood that stocks will have any quick bounces up, rather a temporary drop becomes probable. Also, the market in September and October historically tends to under-perform.  Other than that, most economic indicators don't point to any dramatic shifts coming.  The net result is that if past economic performance is any guide, the market shouldn't be going anywhere in the next half year.


(Click on image to enlarge.)


Sunday, July 31, 2016

Stock Market Forecast August 2016 through January 2017: Flat

My six month stock market forecasting models expect zero gains over the next half year with about normal odds of at least breaking even.

The stock market rebound from the 'Brexit' dip has been spectacular. However, no two ways about it, my short term trading model was completely wrong, having turned negative last month. I missed the rebound entirely.

My 6 month forecast made at the start of February did better -- it had projected very good 9% gains to come over the period. That is closer to what actually transpired.

Well, what can I say?  My models don't know anything about politics or human emotions. They only consider basic economic variables that have been shown over the past half century to generally lead the stock market by several months.  What they say now is that some sort of short term market tumble of up to about 10% is looking pretty likely over the next several months. Doesn't mean that will happen, just means that the models say it is likely.