Thursday, September 1, 2016

Stock Market Forecast September 2016 thru February 2017: No Net Gain

Six months from now the U.S. stock market should wind up right where it is today, at least that is what my forecasting models expect. No net gain for he next six months and only about a 50/50 chance that stocks do better than break even. In between, the models have been expecting the market to stumble with a drop of perhaps 5%.

What's up?  The market has been hitting new highs so there is relatively little likelihood that stocks will have any quick bounces up, rather a temporary drop becomes probable. Also, the market in September and October historically tends to under-perform.  Other than that, most economic indicators don't point to any dramatic shifts coming.  The net result is that if past economic performance is any guide, the market shouldn't be going anywhere in the next half year.


(Click on image to enlarge.)


Sunday, July 31, 2016

Stock Market Forecast August 2016 through January 2017: Flat

My six month stock market forecasting models expect zero gains over the next half year with about normal odds of at least breaking even.

The stock market rebound from the 'Brexit' dip has been spectacular. However, no two ways about it, my short term trading model was completely wrong, having turned negative last month. I missed the rebound entirely.

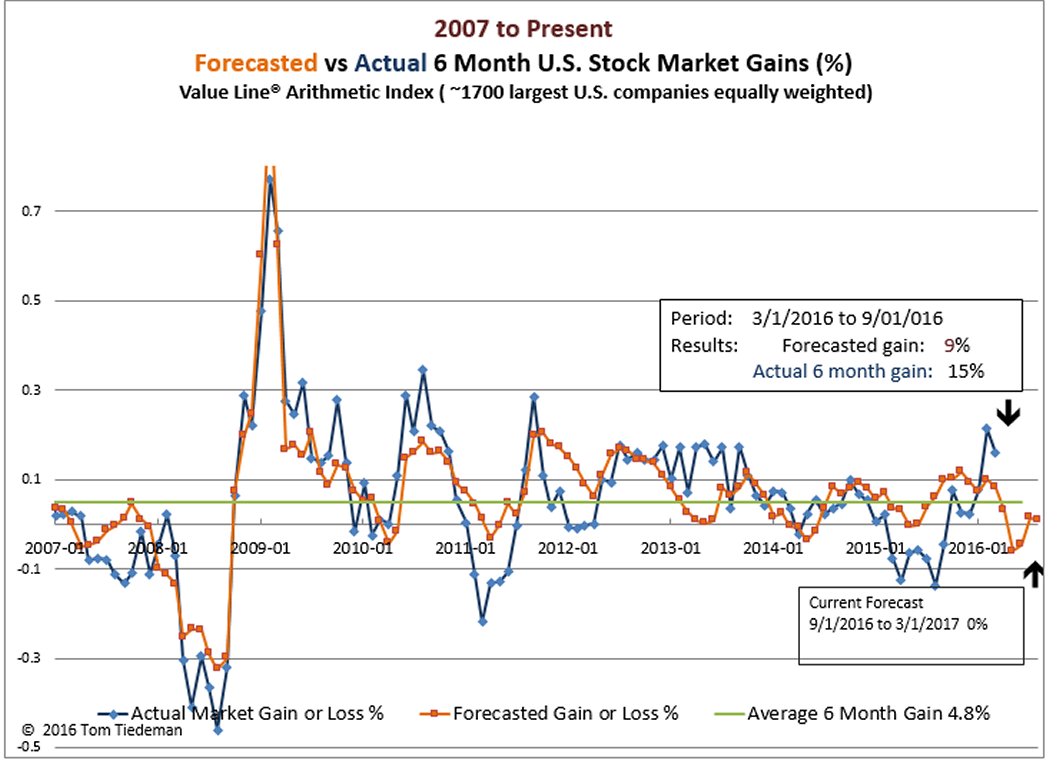
My 6 month forecast made at the start of February did better -- it had projected very good 9% gains to come over the period. That is closer to what actually transpired.

Well, what can I say?  My models don't know anything about politics or human emotions. They only consider basic economic variables that have been shown over the past half century to generally lead the stock market by several months.  What they say now is that some sort of short term market tumble of up to about 10% is looking pretty likely over the next several months. Doesn't mean that will happen, just means that the models say it is likely.


Saturday, July 2, 2016

Stock Market Forecast July 2016 through December 2016:Below Average


My forecasting models expect some market weakness for the next few months, but project that the market will do somewhat better in the closing months of 2016.  Overall, the models forecast a gain of just 1.3 percent between now and the end of 2016.  The probability of at least breaking even over the coming half year is about 70%  -- very close to the market's long term average.


(Click on chart to enlarge.)


The short term market forecast remains negative.  The model turned negative at the start of June and remains mildly negative.  The model is not likely to issue a buy signal in August either.


(Click on image to enlarge.)
Overall, the U.S. stock market has been behaving fairly close to the models' expectations.  In January the model had projected a 7.3% market gain in te first half of 2016 and the actual market gain was exactly the same 7.3%.  In June the one-month trading model turned negative -- ahead of the brief Brexit market tumble.

On the whole the market seems to be normal, reacting about the same as it usually does to the economic variables that typically foretell market direction. If that continues, we can expect a couple more weak months before prospects improve.


Sunday, May 29, 2016

Stock Market Forecast June 2016 through November 2016:Negative

My near term stock market indicator has now turned red. My models do not predict a large stock market drop soon, but they do project that over the next few months the market is more likely to fall than to rise. This negative market outlook is likely to remain for at least the next several months.

(Click on image to enlarge.)

This is the second month that my econometric models expect the U.S. stock market to drop over the next 6 months -- by about 5%.  I calculate that there is about a 40% chance the market will break even in the next half year, versus a 74% chance on average.  For the past year or so the market has steadily performed worse than my forecasts so it wouldn't surprise me if the actual results come in somewhat worse than my pessimistic forecast. Something outside the scope of my models is causing the market to perform poorly.

What's behind this negative 6 month stock market projection? Typical seasonal market weakness is part of the reason: on average, but not always, the stock market performs worse during summer months than the rest of the year.  The bigger problem, however, is that as far as my model is concerned, there is little reason for the market to go up.  The market is near fair market pricing, leading economic indicators are weak, and interest rates appear more likely to go up a bit rather than falling.

As I noted above, the stock market has been performing somewhat worst than my models had expected.  Looking at the graph below, the market does appear to be following a normal seasonal pattern -- the colder months of the year are generally more favorable to the stock market than warm months.  Overall, however, actual market changes over 6 month periods have been distinctly worse than the models had predicted.  Over the past 6 months, for example, the market rose about 2.5%, but my models had forecast a much stronger 9% rise.  As always, the market will do whatever it 'wants' to do, but my models are getting gloomy.

(Click on image to enlarge.)


Sunday, May 1, 2016

Stock Market Forecast May 2016 Through October 2016: Looking bad

May 2016 through October 2016:  Watch out. The six month stock market forecast is bad and the near term forecast is flashing yellow.  Next month the short term forecast will almost certainly turn red. My forecasting models expect the U.S. stock market to fall significantly over the coming half year; and that doesn't factor in the presidential election which is likely to create additional volatility.

The models predict that the stock market will decline about 6 percent from now through the end of October. The probability that the market will decline over the period is high.  The odds that the market will fall by at least 8% at some point over the next six months are high -- about 1 in 4.

As shown in the graph below, the stock market has performed below the expectations of the model for more than a year. If that continues, actual market results in the next six months could be significantly worse than the bleak forecast now given by the model.

(Click on image to enlarge.)

The immediate prospects for the stock market, however, are much less clear and are not as bad as the longer term forecast.  As shown below the short term forecasting model is now flashing a warning.  Based on the current negative 6 month forecast next month the short term forecasting model will probably be flashing a sell signal.


(Click on image to enlarge.)


Thursday, March 31, 2016

Stock Market Forecast April 2016 Through September 2016: Below Average


April 2016 through September 2016: My forecasting models expect positive, but below average market gains over the next 6 months. (roughly 3% gain, 70% chance for break even with 73% being the long term break even probability.)

Spring flowers are just starting to come up where I live, but my stock market forecasting models are already anticipating that stock market gains over summer months will be weak following a normal seasonal pattern. The model says that 3% projected gains through the end of September will be below long term stock market price appreciation.  My models know nothing about politics, but personally I will bet on some sort of market stumble as the Republican and Democratic presidential conventions get underway.

That said, it is still springtime so April, and probably May will likely produce better than average results. The second graph below shows that a time lagged forecast using my models remains bullish.


(Click on image to enlarge.)


(Click on image to enlarge.)


Tuesday, March 1, 2016

Stock Market Forecast March 2016 Through August 2016: Above Average Gains

March 2016 through August 2016: Above average gains (roughly 8%, 85% chance for break even)

The stock market continues to lag the models' forecasts, but the gap appears to be closing. The model is saying that once again the market has predicted a recession that didn't happen. Current forecasts from the model remain optimistic -- nothing beats a crazy stock downturn for making the market future look brighter.


(Click on image to enlarge.)